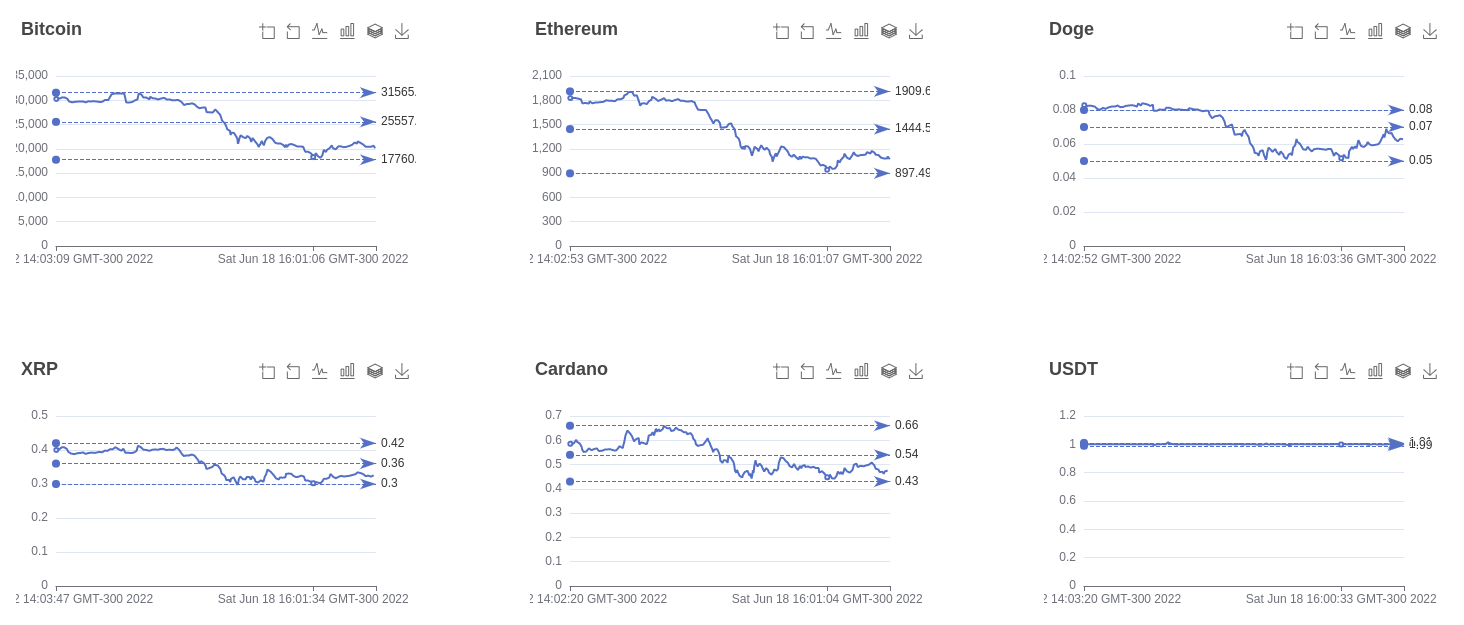
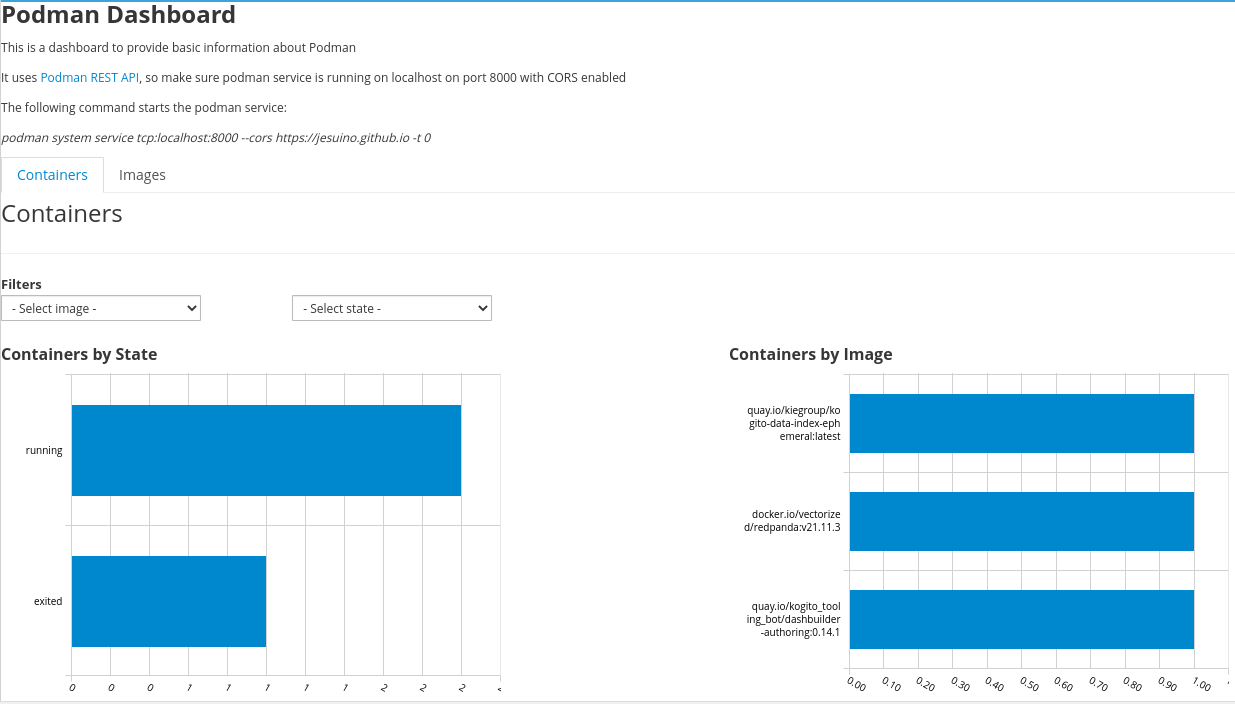
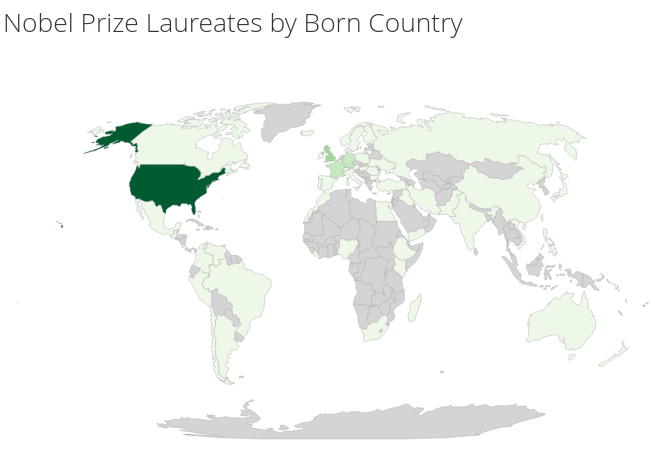
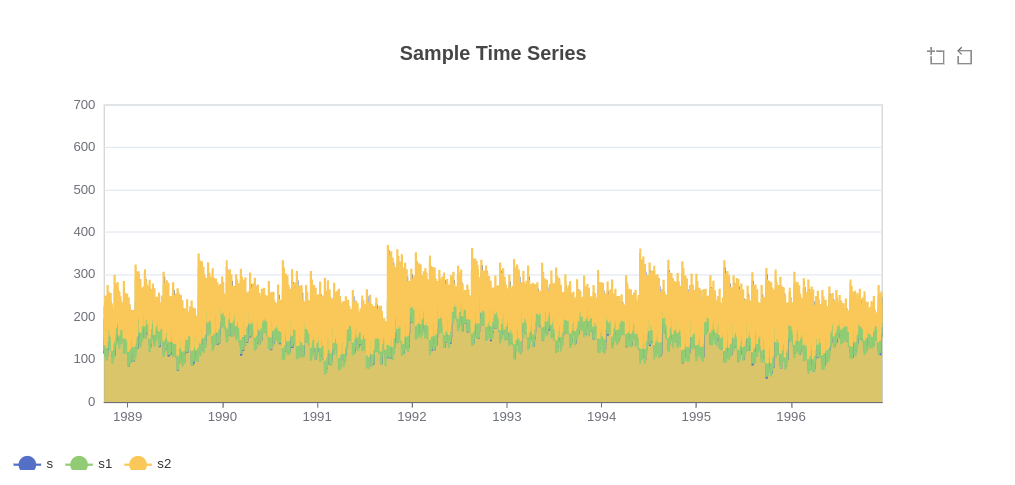
Easy dashboards and data storytelling with Dashbuilder
A fast, easy-to-use, cloud-native and open source data visualization tool for software developers
Or check the samples in the Dashbuilder Online Editor
Check the documentation and the getting started guide to learn more about Dashbuilder.
Create dashboards your way
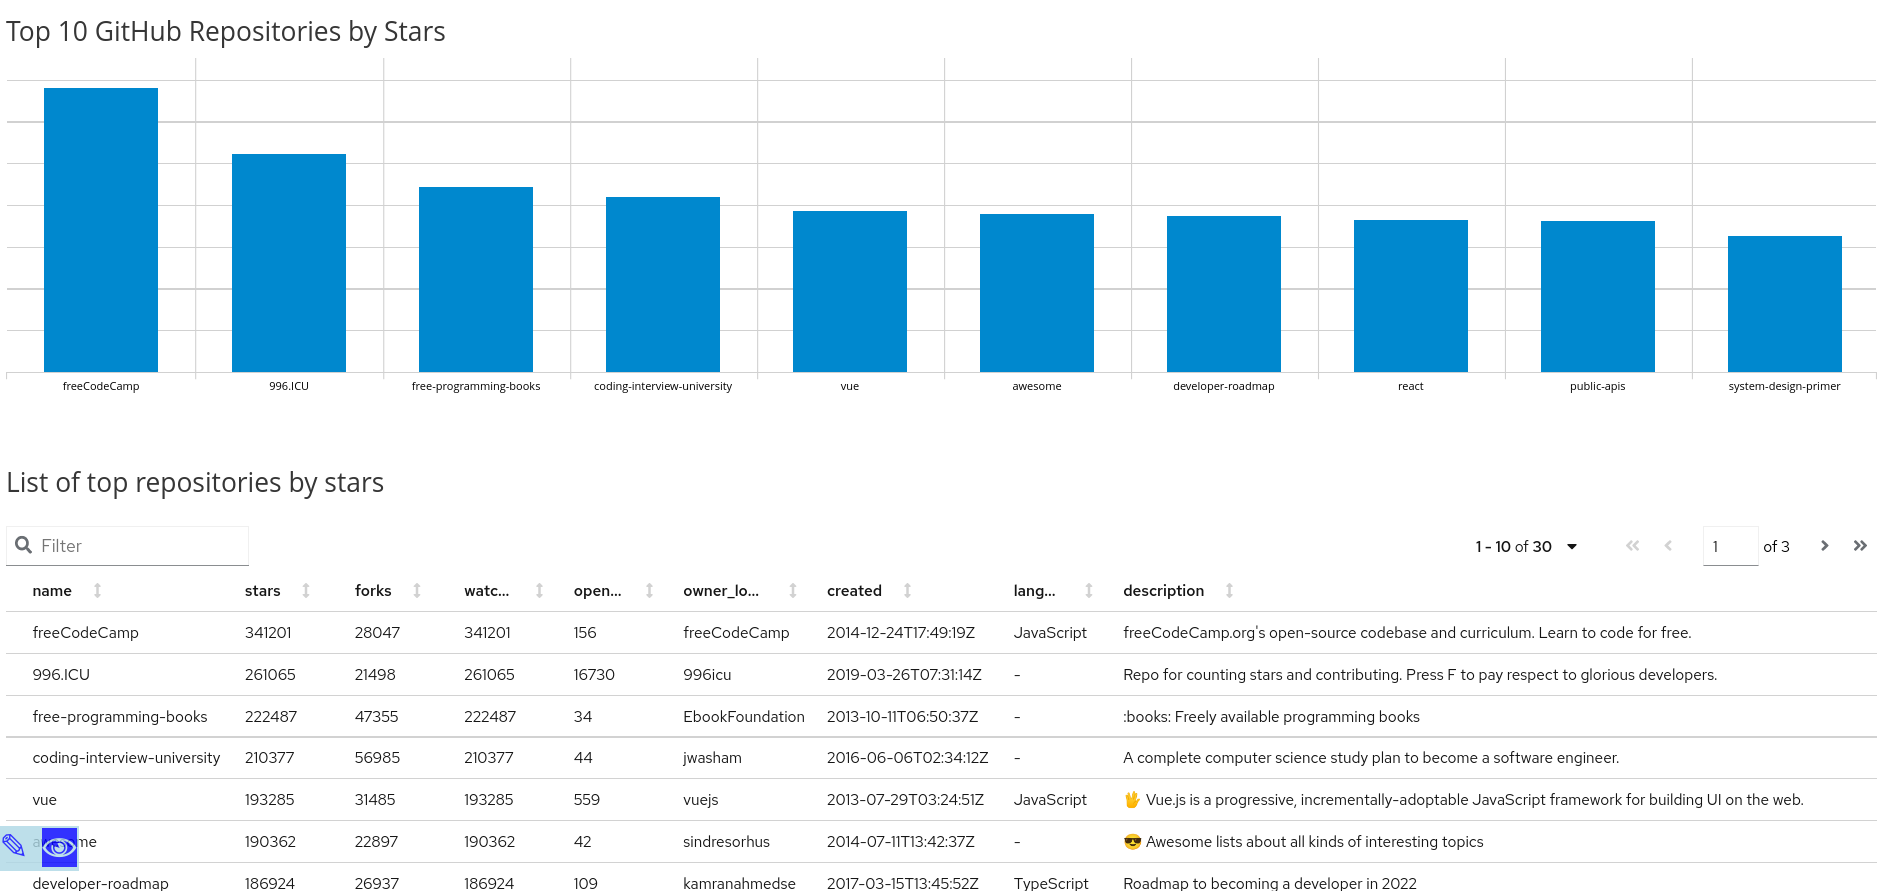
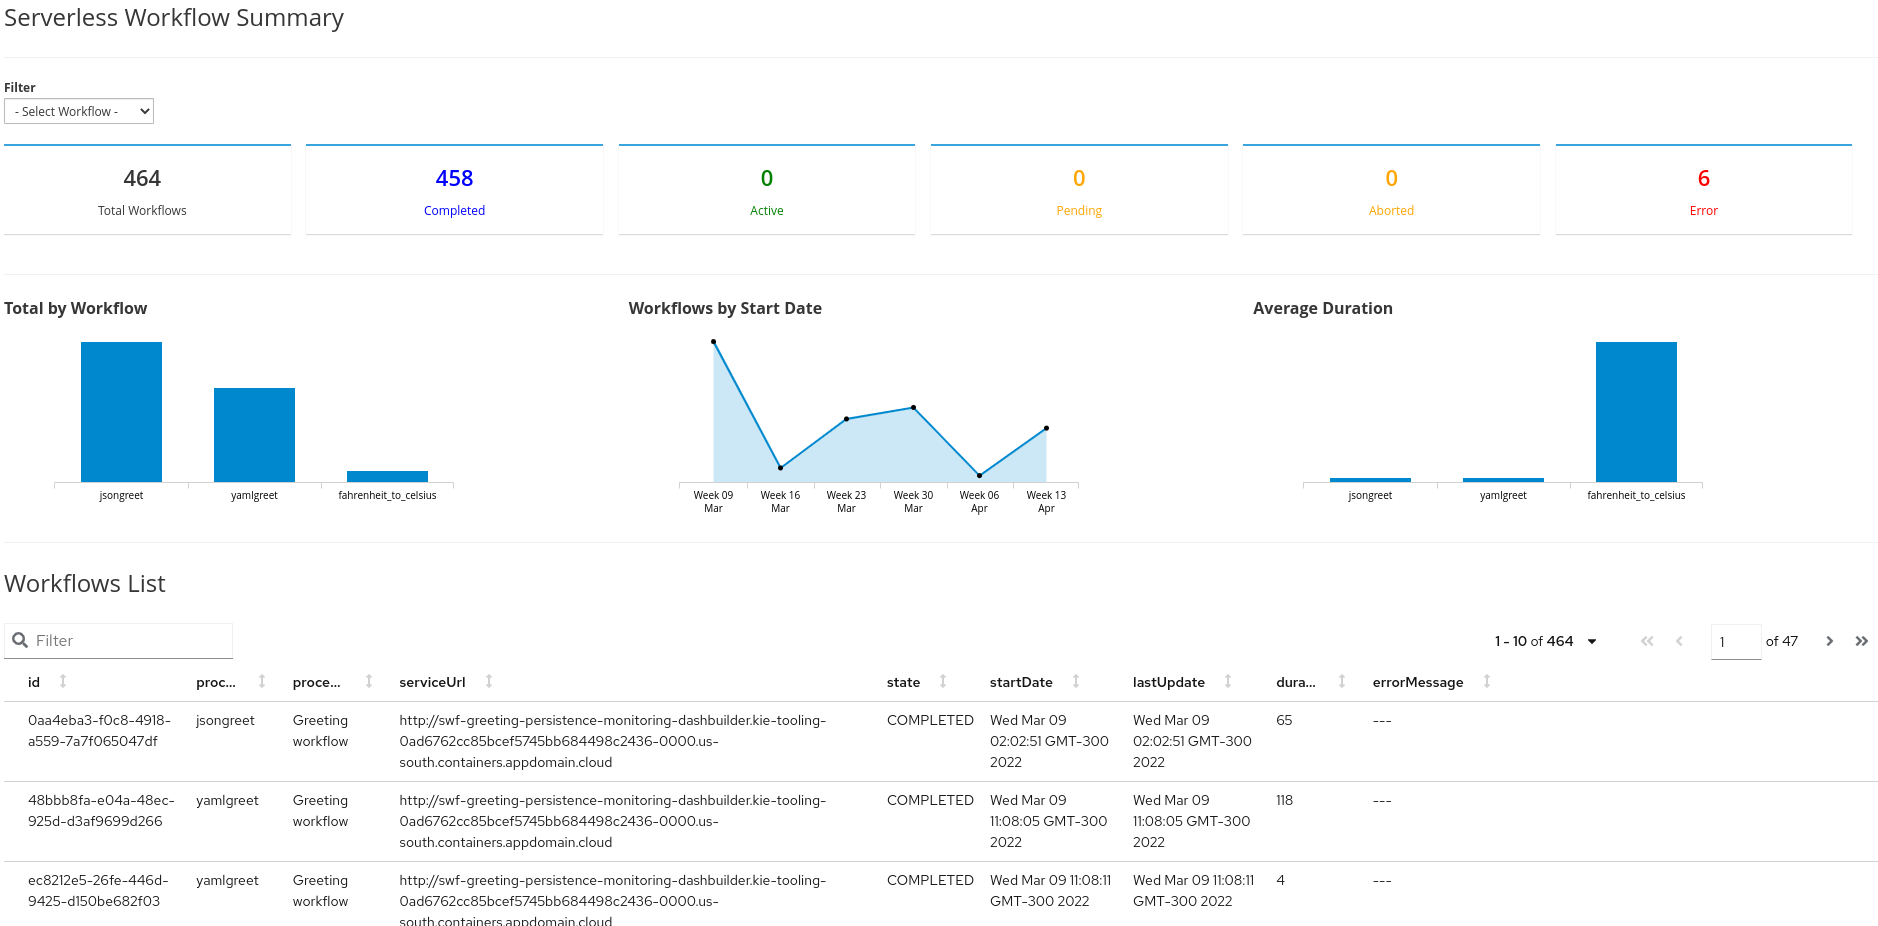
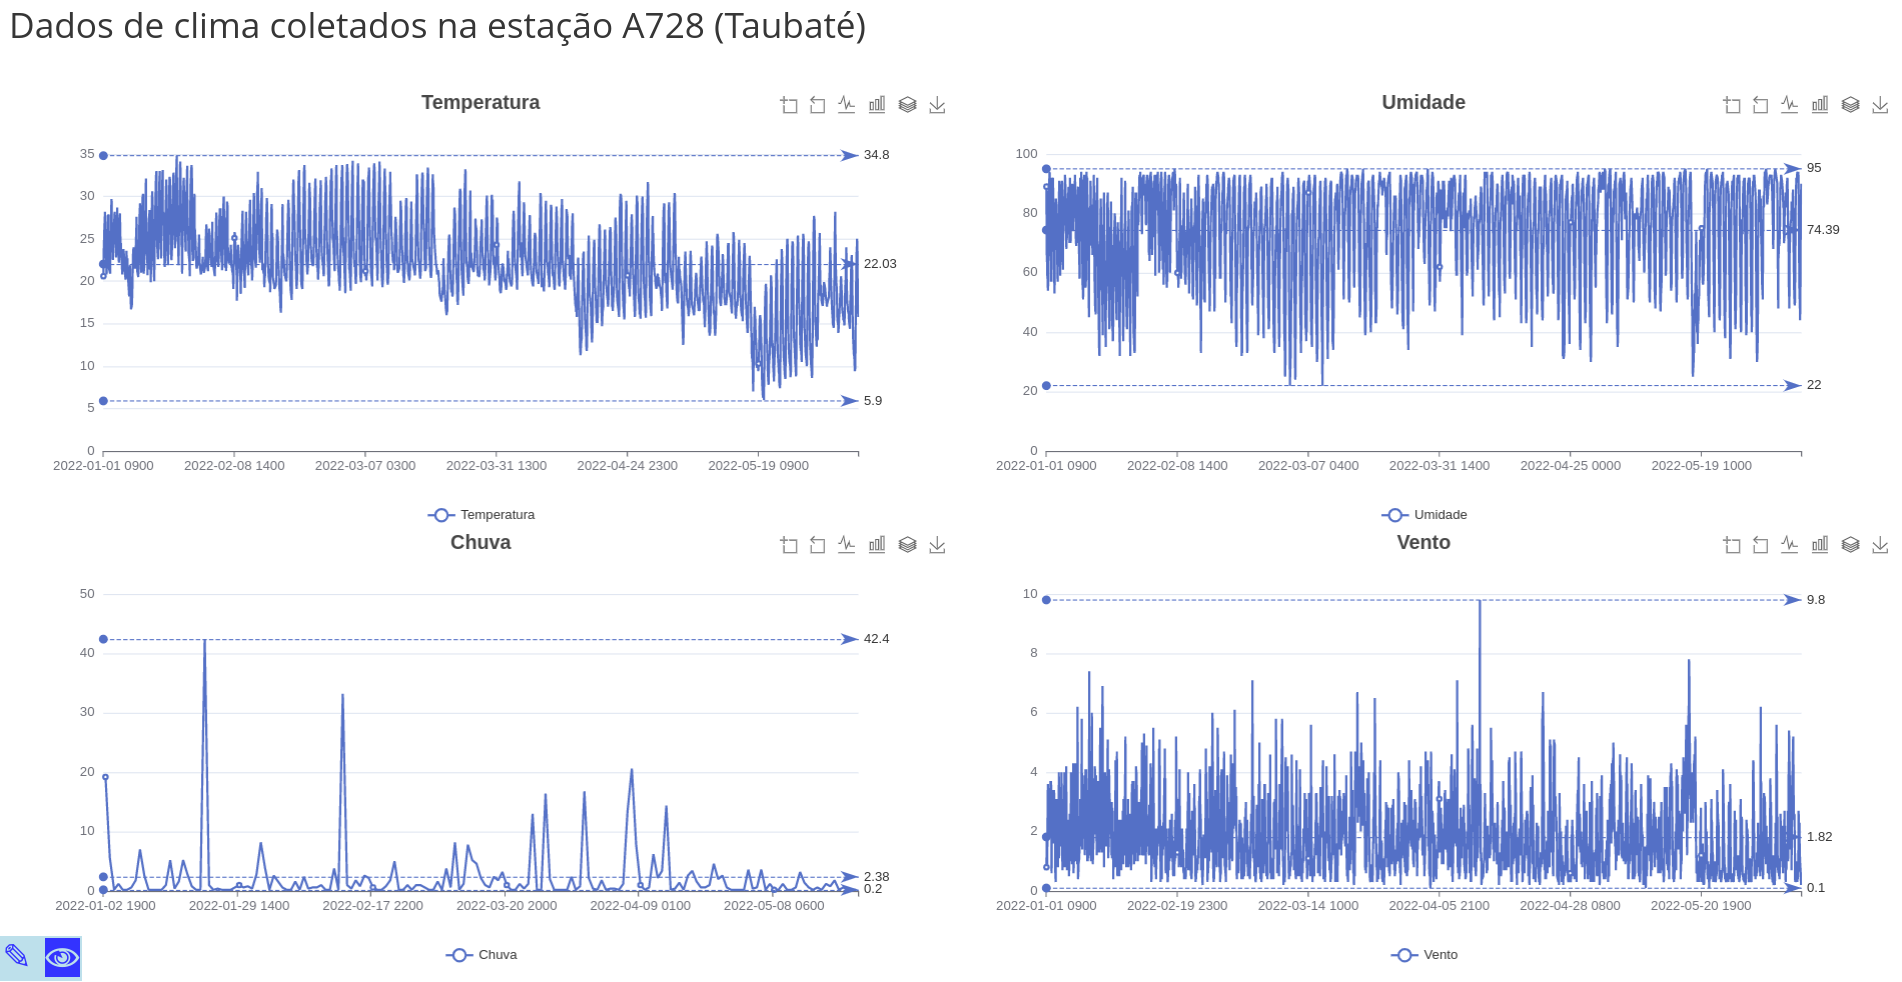
Dashbuilder supports dashboards created from YML or with a drag and drop tool. You can make use of internal visual components or build your own.
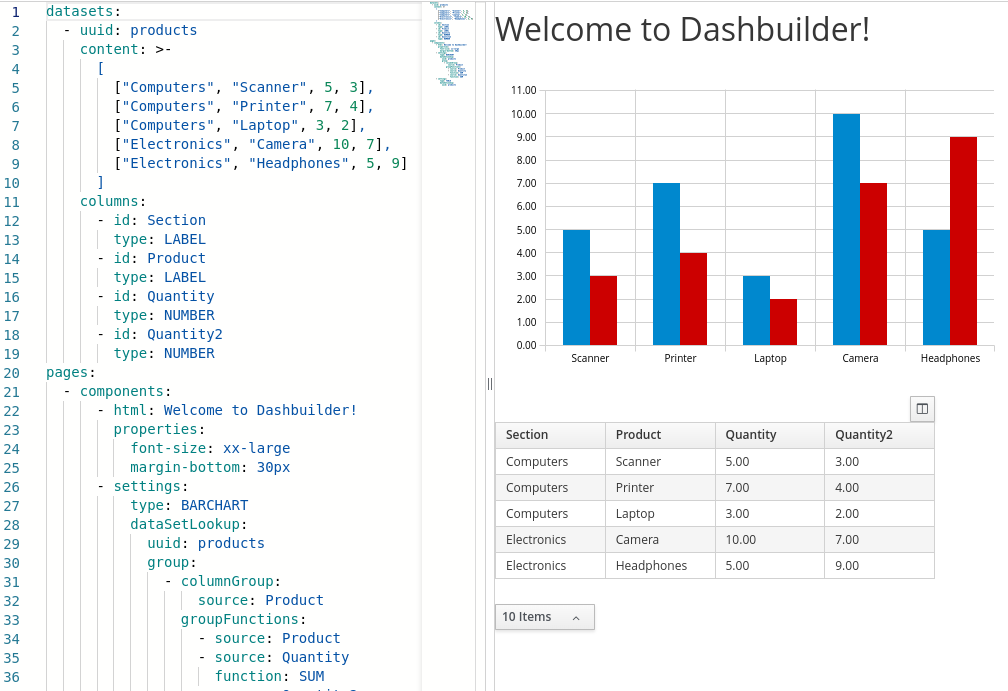
YML
Author dashboards in a browser client-side editor using YML language. Export a client-only application to use anywhere or keep it stored in the cloud.
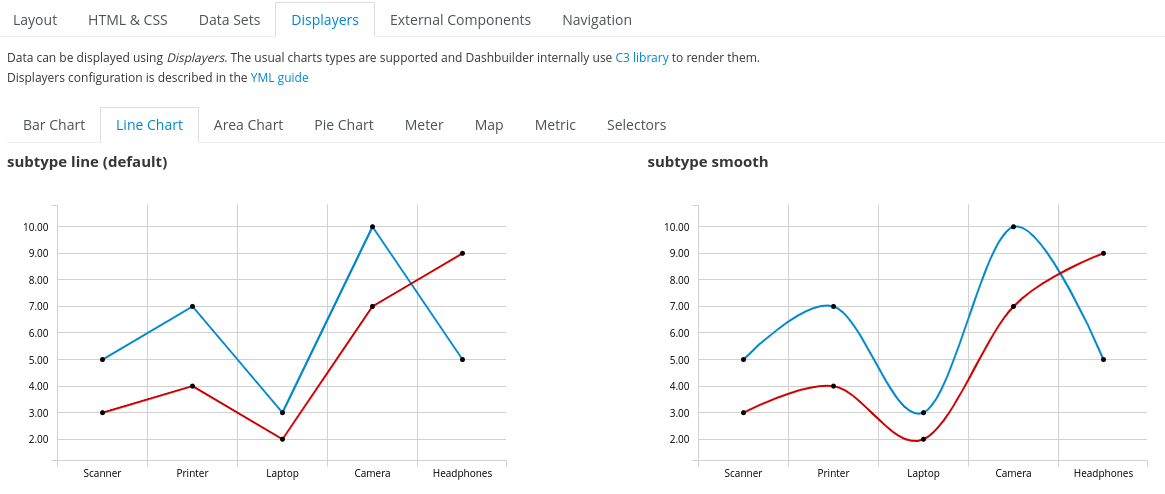
Visual Components
Dashbuilder comes with a full set of traditional visual components, but developers can extend the components library by building their own.
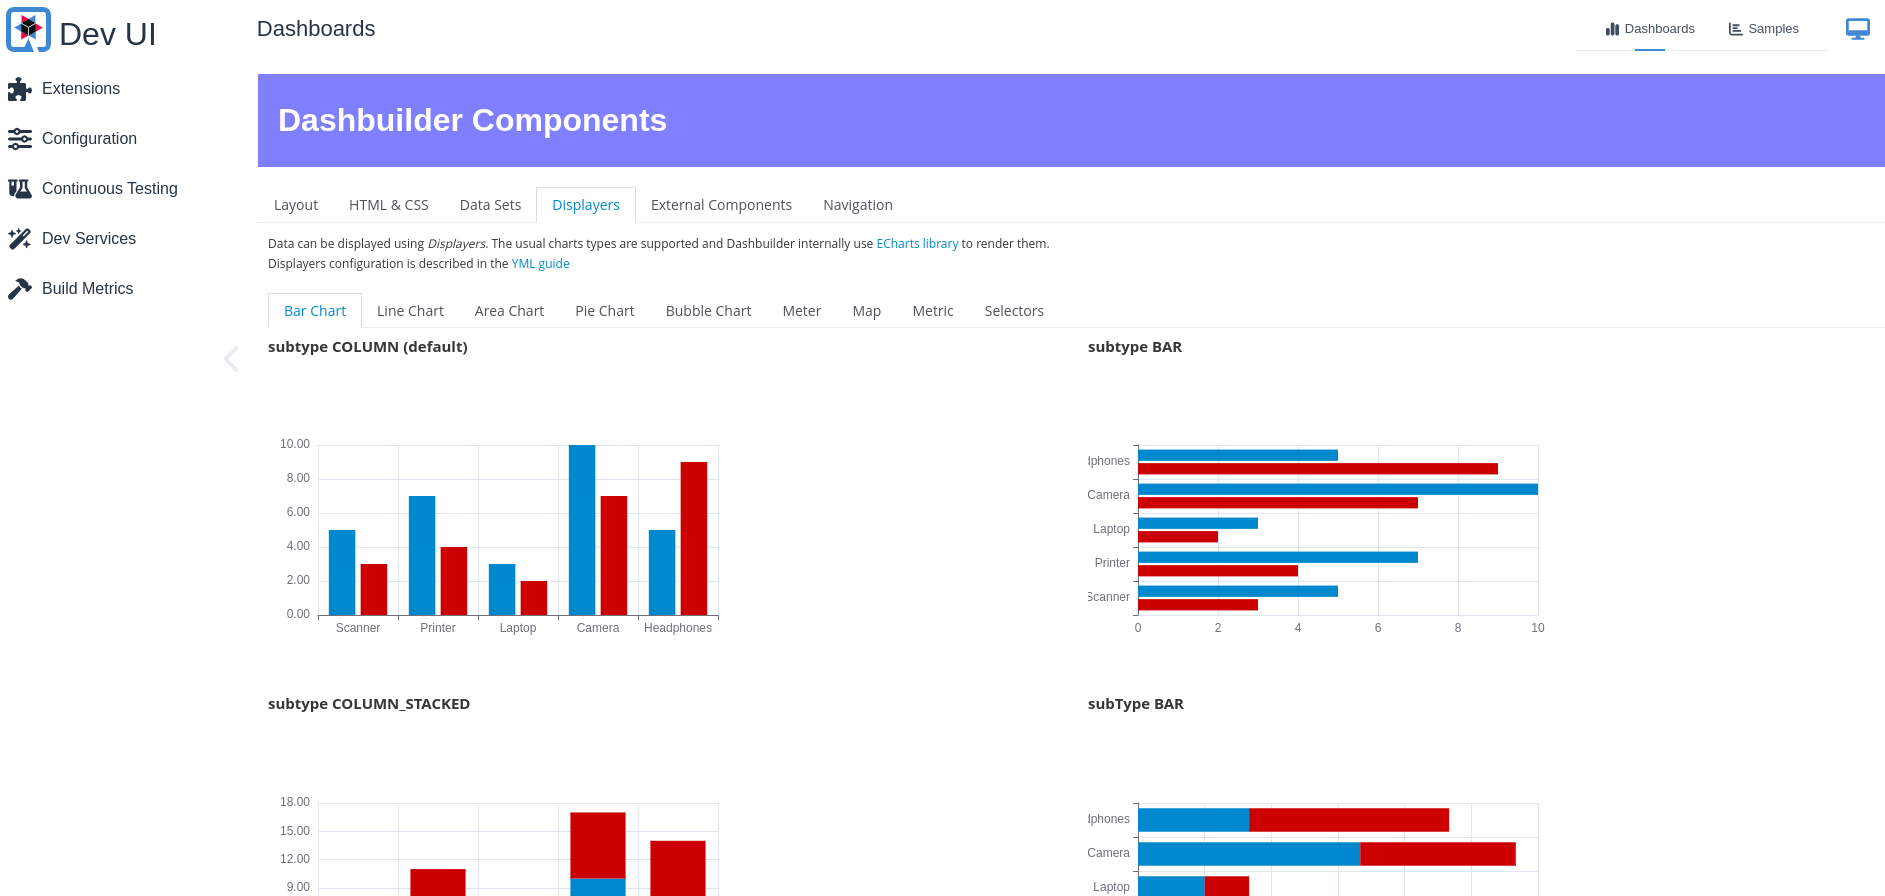
Quarkus Extension
Bring dashboards to your Quarkus application by using the Dashbuilder extension.
-
Mon 8 May 2023
William Siqueira
-
Fri 23 December 2022
William Siqueira
-
Fri 11 February 2022
William Siqueira
-
Fri 11 February 2022
William Siqueira
-
Thu 10 February 2022
William Siqueira
-
Quarkus Insights #119: Dashbuilder Quarkus Extension spotlight
Mon 27 February 2023
William Siqueira
-
Publishing Dashboards to Github Pages in minutes
Sat 21 January 2023
William Siqueira
-
Exploring Dashbuilder Components
Wed 22 June 2022
William Siqueira
-
[KieLive#37] How to work with dashboards layouts
Fri 29 January 2021
William Siqueira
-
Queries for Building Kie Server Dashboards in jBPM
Thu 14 January 2021
William Siqueira
